Comm Voice
Community Voices: Area Median Income drives program funding

Welcome to the Catalyst’s Community Voices platform. We’ve curated community leaders and thinkers from all parts of our great city to speak on issues that affect us all. Visit our Community Voices page for more details.
Area Median Income, also known as AMI or sometimes referenced as Median Family Income (MFI), is the household income for the median/”middle” household in a given region. Thus, if you were to line up each household from poorest to wealthiest, the household in the very middle would be considered the median.
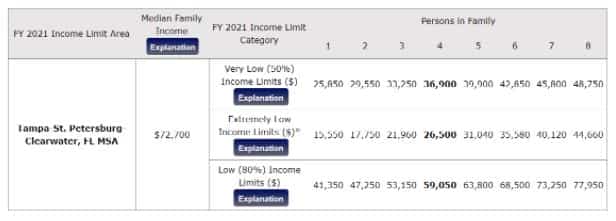
The middle or median income of an area is utilized to benchmark income levels, and highlight the need for programs or services within a given community. The income benchmarks are calculated and adjusted based on family/household size. Therefore, a single individual will have a lower income threshold than a family of four. (see chart below)
The vast majority of all federal, state and local housing programs qualify participant eligibility based on income levels. To accomplish this, housing programs utilize the same benchmark of income data released by the Housing and Urban Development Department (HUD) annually (typically in the spring). The income limits/guidelines are calculated using American Community Survey (ASC) data for all regions in the US.
Both Pinellas and Pasco Counties are in the Tampa-St. Petersburg – Clearwater MSA and therefore utilize the same regional AMI data.
Tampa-St. Petersburg-Clearwater, FL MSA contains Hernando County, Hillsborough County, Pasco County and Pinellas County.
To estimate your household’s area median income; first add all household wage-earners gross income (income before any taxes or other deductions) then total how many individuals (both adults and children) reside in the household. Once you have those two numbers, locate your household size on the chart above and then locate the closest income limit category to your own household income.
Example: John and Susie Smith are a married couple with 3 small children. Their household size totals five (two adults and three children). John’s gross annual income is $28,000, while Susie’s gross annual income is $32,500 for a total gross annual household income of $60,500. Looking at the AMI chart above, the Smith family falls in the low income limit category, just below the 80% area median income benchmark.
General terms/definitions by income level:
Workforce Housing = 81% to 120% AMI
Moderate to Low Income = 50% – 80% AMI
Very Low to Extremely Low = 30% – 50% AMI
As stated above, funding and/or program eligibility will often utilize AMI ranges to qualify program participants for program or service eligibility. Programs will generally serve specific income ranges based on AMI and/or have different levels of assistance or services based on AMI. This is why AMI can be significant, as it is often one of the primary determining factors for housing services eligibility.
Note: Not all programs and/or funders will use this benchmark or may not even use the benchmark in the same manner. However, generally speaking, these will be the income levels used in most programs.
Mike Sutton is President and CEO at Habitat for Humanity of Pinellas and West Pasco Counties.